
Mean, Median, Mode Calculator – With Steps & Dot Plot
Paste your numbers and get the mean, median, mode and range in one go. Each answer comes with the working. A dot plot shows where your numbers sit and how far one odd value can drag the average. Data in a frequency table or with weights? Switch tabs.
How the mean was found
How the median was found
How the mode was found
Quartiles and outliers
The math
How to Use This Calculator
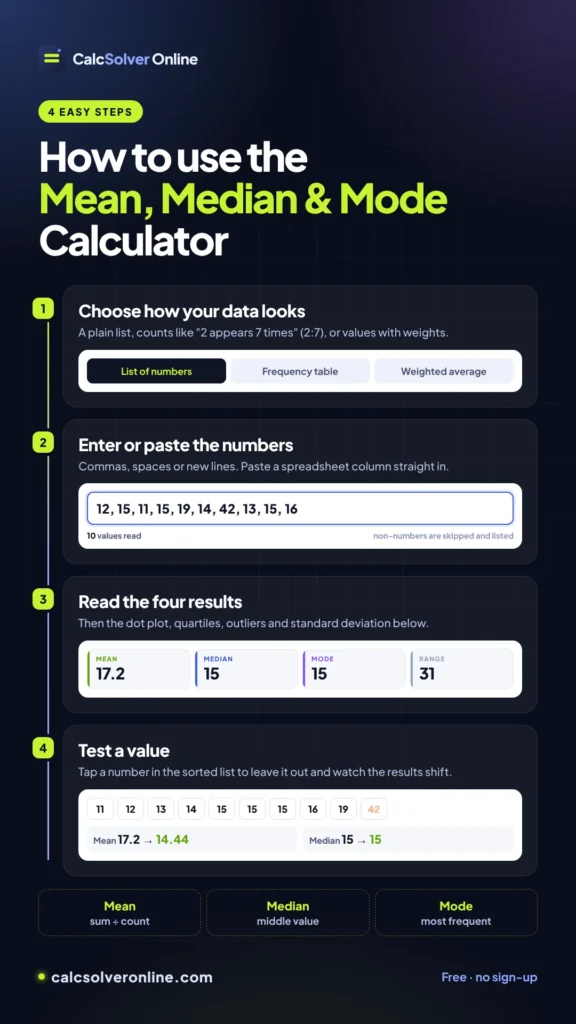
- Choose how your data looks. Use List of numbers for raw values. Use Frequency table when you have counts, like “the value 2 appears 7 times” (type 2:7). Use Weighted average when some values count more than others.
- Enter or paste the numbers. Commas, spaces and new lines all work, so you can paste a spreadsheet column. Anything that isn’t a number is skipped and listed.
- Read the four results. Mean, median, mode and range sit at the top. Below them you get the dot plot, quartiles, outliers and standard deviation.
- Test a value. Tap any number in the sorted list to leave it out and see how the results shift.
What Mean, Median and Mode Tell You
All three describe the centre of a data set, each in its own way.
- Mean: add every value and divide by how many there are. This is what most people call “the average”.
- Median: the middle value once the numbers are sorted. Half the data sits below it and half above.
- Mode: the value that appears most often. A set can have one mode, several, or none.
- Range: the largest value minus the smallest. It measures spread, not centre, but it’s usually reported alongside the other three.
How to Find Each One by Hand
Take ten commute times in minutes: 12, 15, 11, 15, 19, 14, 42, 13, 15, 16.
Mean: the values add up to 172. Divide by 10 to get a mean of 17.2.
Median: sort them first: 11, 12, 13, 14, 15, 15, 15, 16, 19, 42. With an even count there is no single middle value, so average the 5th and 6th: (15 + 15) ÷ 2 = 15. With an odd count, the median is the value at position (n + 1) ÷ 2. For 9 values, that’s the 5th.
Mode: 15 appears three times, more than any other value, so the mode is 15.
Range: 42 − 11 = 31.
When There Is No Mode or More Than One
If no value repeats, as in 1, 2, 3, 4, 5, there is no mode. The same goes for a set where every value appears equally often, like 1, 1, 2, 2, 3, 3. Nothing stands out, so the calculator shows “None” instead of listing every value.
When two values tie for most frequent, the data is bimodal. In 2, 4, 4, 6, 8, 8, both 4 and 8 appear twice, so both are modes. With three or more modes the set is called multimodal.
Mean vs Median: Which One Should You Use?
Back to the commute times. Nine trips took 11 to 19 minutes. One took 42. That single trip pulls the mean up to 17.2, which is higher than eight of the ten values. The median stays at 15. Remove the 42 and the mean drops to 14.44, while the median is still 15.
That’s the rule of thumb:
- Use the median when a few values are far from the rest, as with incomes, house prices and wait times.
- Use the mean when the data is fairly even with no extreme values, like test scores in a class or daily temperatures.
- Use the mode for the most common choice, such as a shoe size or survey answer. It’s the only one of the three that works for categories as well as numbers.
When a few high values pull the mean above the median, the calculator points it out under the dot plot.
Quartiles, IQR and Outliers
Quartiles split sorted data into four parts. Q1 is the median of the lower half and Q3 is the median of the upper half. When the count is odd, the middle value is left out of both halves. The interquartile range (IQR) is Q3 − Q1. It covers the middle 50% of your data.
A common outlier test uses fences 1.5 × IQR beyond the quartiles. For the commute times, Q1 = 13 and Q3 = 16, so IQR = 3. The fences are 13 − 4.5 = 8.5 and 16 + 4.5 = 20.5. The 42 falls outside them, so the calculator marks it in orange as an outlier.
Textbooks and software use slightly different quartile methods, so your class may get a slightly different Q1 or Q3. The percentile calculator puts three of these methods side by side.
Weighted Average
A weighted average lets some values count more than others. Multiply each value by its weight, add the results, then divide by the total weight.
Say homework is worth 20% of a grade, quizzes 15%, tests 40% and the final 25%. With scores of 88, 75, 82 and 90:
(88 × 20 + 75 × 15 + 82 × 40 + 90 × 25) ÷ 100 = 84.15
The plain average of the four scores is 83.75. The weighted result is higher because tests and the final carry more weight. Your GPA is worked out the same way, with credits as the weights, and the GPA Calculator handles that part. To find the score you need on an upcoming exam, use the Final Grade Calculator.
Mean, Median and Mode in Excel and Google Sheets
| What you want | Formula |
|---|---|
| Mean | =AVERAGE(A1:A10) |
| Median | =MEDIAN(A1:A10) |
| Mode (one value) | =MODE.SNGL(A1:A10) |
| All modes | =MODE.MULT(A1:A10) |
| Range | =MAX(A1:A10)-MIN(A1:A10) |
| Standard deviation | =STDEV.S(A1:A10) for a sample, =STDEV.P(A1:A10) for a whole population |
Two catches. MODE.SNGL returns only one value even when the data has several modes, so use MODE.MULT to see them all. If nothing repeats, both return #N/A instead of “no mode”.
Frequently Asked Questions
Is the mean the same as the average?
In everyday use, yes. “Average” usually means the arithmetic mean. In statistics, the median and mode are also called averages, which is why a report should say which one it uses.
Can the mean, median and mode all be equal?
Yes, when the data is perfectly symmetrical. In 2, 4, 4, 6, the mean, median and mode are all 4. In a normal (bell-shaped) distribution, all three sit at the same centre point.
Should I use sample or population standard deviation?
Use population if your numbers cover the whole group, like every student in one class. Use sample if they are a selection from a bigger group. The sample version divides by n − 1, so it comes out slightly larger.